Once all the data is collected it is time stamped and corrected to match the
time of the test. A computer program or spreadsheet is now utilized to take the
data input and calculate the tonnage of the system {btu/h (water) = 500 x (T in
- T out) x flow (gpm)} averaged over a certain time period (15
minutes). The demand and outdoor conditions are added to the data set and
time stamped.
|
Values for Chiller #1 |
|
|
|
|
|
|
|
|
|
||||||
|
VALUES |
kW |
P.F. |
CHWS |
CHWR |
CWS |
CWR |
CHILLED |
COND. |
CHILLER |
kW/TON |
|||||
|
5/17 to 5/26/95 |
|
|
|
|
|
|
FLOW |
FLOW |
TONNAGE |
|
|||||
|
AVERAGE |
148.3 |
0.77 |
45.2 |
50.1 |
78.2 |
84.7 |
1155 |
1206 |
255 |
0.801 |
|||||
Once all this is together graphs and charts can be put together to help
analyses the system.
![]()
Individual Chiller Performance curves can be developed based on the calculated load and energy input to the motor.

A load profile is developed based on the wet-bulb or dry-bulb temperature. This is an excellent tool in estimating the need for more capacity, based on estimated outdoor conditions and the present load. This test is best done in the summer months, but can be a good test at other time to determine the proper loading of multiple-chiller installations.

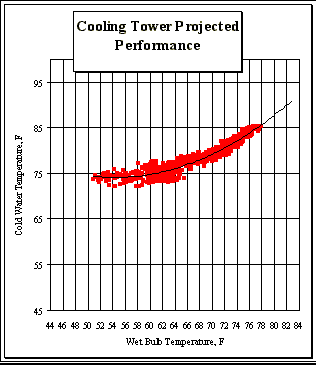
Efficiency of Cooling Towers are not as easy to "calculate" but
load profiles can be generated to see if a tower is providing the capacity
it was originally designed for.
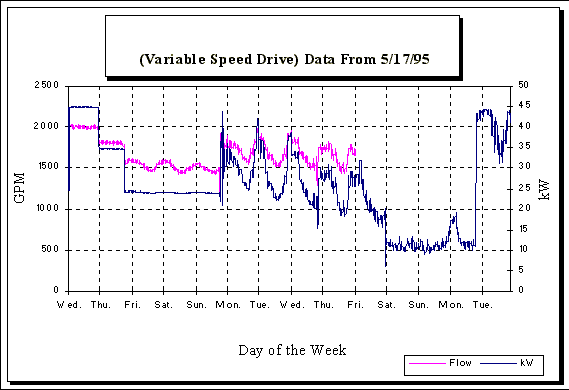
Other systems can be tested such as Variable Speed Drives. The chart below indicates the flow changes in a chilled water pump system and the resulting kW demand decrease. I authored an article for the EPRI Advanced Motor Drive News on this issue.
![]()
![]()